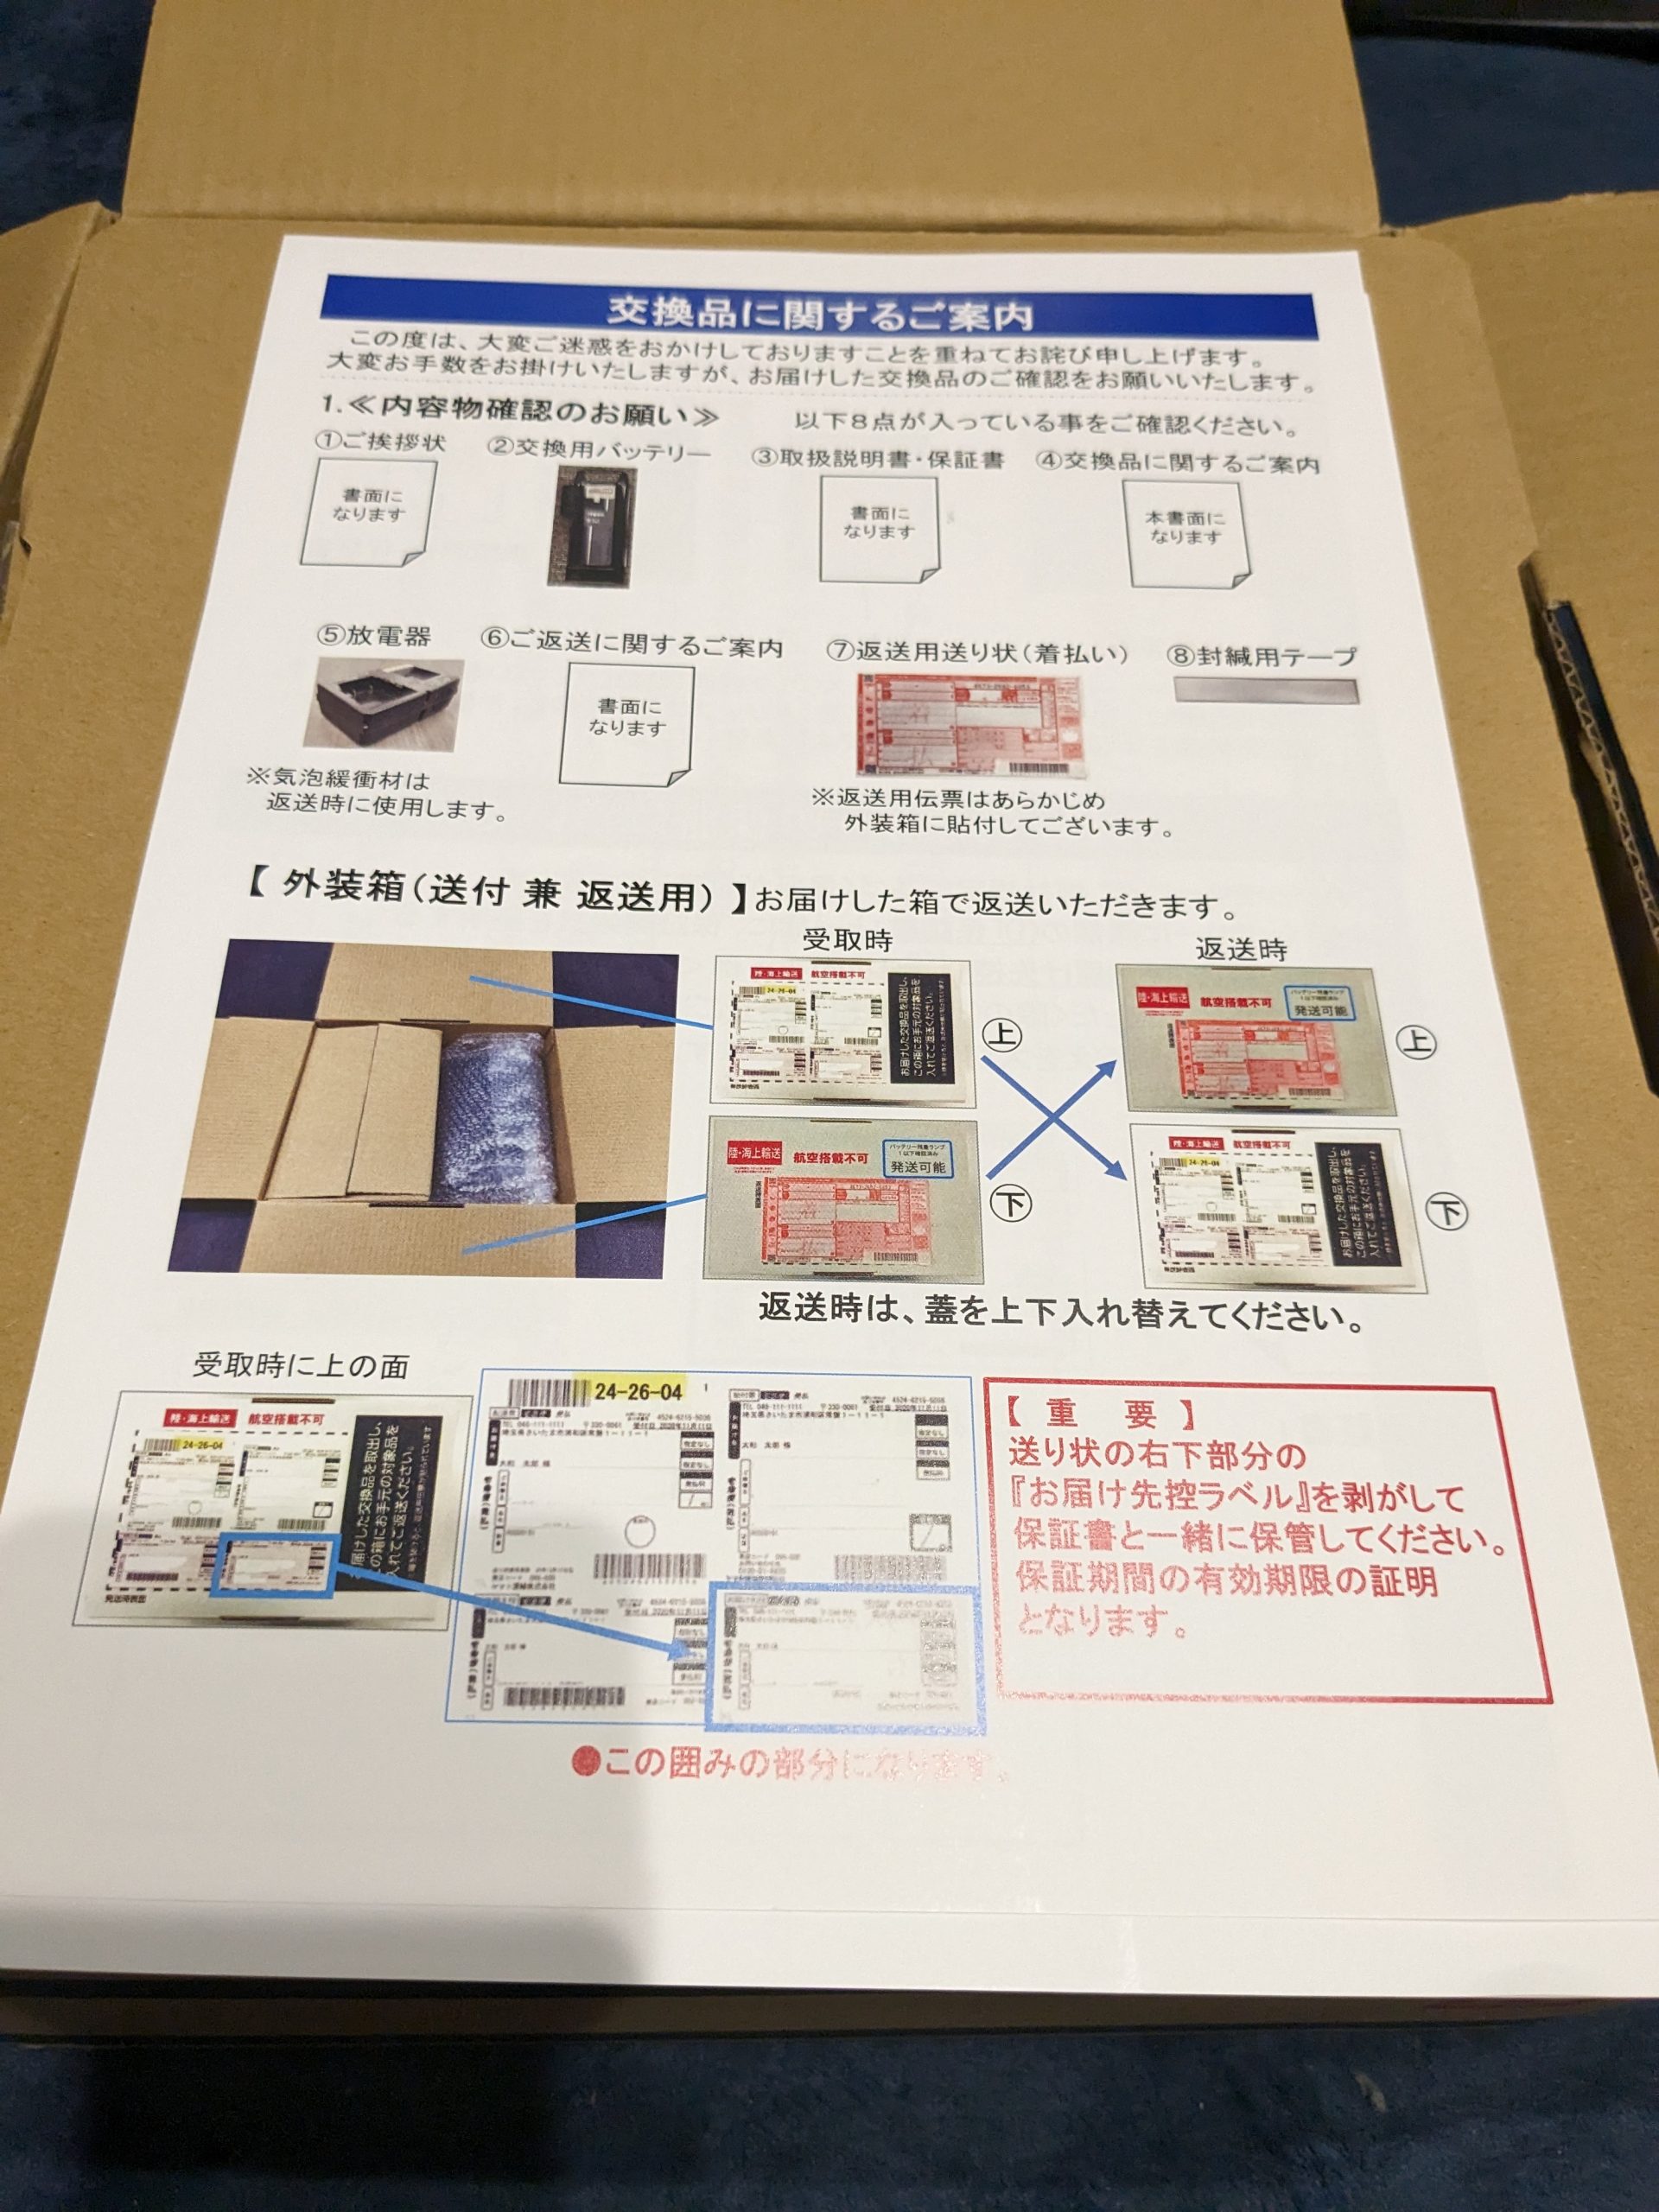
取説(マニュアル)
千石電商で購入した安価なパルスオキシメーター RS-E1440の説明書です。ネットに上げて、紙はすてます。
Choosing wisely among possible courses of action requires knowledge about the effects of those actions. Public health and medical decision makers therefore need sound causal inferences to know what works and what harms people. Decision makers prefer inferences based on randomized trials because random assignment of treatment strategies is expected to result in comparable treatment groups, permitting outcome differences to be attributed to the treatment rather than to preexisting differences between groups.
Indeed, for each question about causality, the target of inference can be specified as a randomized trial that would answer the question — the “target trial.” But we cannot conduct enough target trials to answer all causal questions about all treatment strategies and all outcomes in all population groups, and trials may take years to complete.
If an appropriate target trial does not exist when a decision must be made, causal inference may need to rely on observational population data (e.g., electronic medical records generated during routine medical care). Because causal inference from observational data can be viewed as an attempt to emulate a target trial, the question is not whether observational data should be used for causal inference, but rather how to use them most effectively.
Causal inference involves specifying a causal question and answering it. The question is articulated in the form of the target-trial protocol, which incorporates eligibility criteria, treatment strategies, treatment assignment, start and end of follow-up, outcomes, causal contrasts (or estimands), and a data-analysis plan. These elements define the causal question and how it will be answered; then the target trial is conducted according to the protocol.
For researchers using observational data, a useful way to specify a question is to design the target trial that would answer it and then emulate the protocol as closely as possible. Emulating randomization generally requires data on prognostic factors that are associated with treatment decisions. If all such confounders were correctly measured and adjusted for, there would be no difference between a randomized trial and an observational analysis emulating it. The idea of target-trial emulation, or its logical equivalents, was central to causal inference methods developed during the 20th century1; James Robins2 generalized it to encompass treatment strategies that are sustained over time.Outline of a Target-Trial Protocol: Specification and Emulation Using Observational Data.
Target trials emulated using observational data are necessarily pragmatic trials lacking a placebo, blind treatment assignment, and blind outcome ascertainment — design features that don’t occur in the real world. Therefore, observational data are not a good fit for causal questions that cannot be expressed in terms of a pragmatic trial. The tableoutlines the elements of the protocol of a target trial and its observational emulation. The principles of target-trial emulation are applicable to any causal question that can be translated into a contrast between sufficiently well-defined interventions.
One example of causal inference from observational data can be found in the story of the HIV-treatment-as-prevention strategy. In 2010, millions of people worldwide had HIV infection. With no vaccine in sight, a possible strategy for reducing transmission was to immediately treat anyone with a positive HIV test (because antiretroviral therapy reduces viral concentration). U.S. guidelines, however, recommended starting therapy in asymptomatic people at CD4 cell counts of 350 per cubic millimeter. Earlier initiation at 500 cells per cubic millimeter or higher was not recommended because of concerns about drug toxicity and accumulating resistance. A decision to change guidelines required evidence about the effectiveness and safety of early therapy initiation, but no randomized trials had generated that evidence.
In 2011, using observational data, U.S. clinical guidelines began recommending that antiretroviral therapy be initiated at 500 cells per cubic millimeter. Earlier, data from an international consortium of observational HIV cohorts had been used to emulate a target trial of various strategies for initiating antiretroviral therapy.3 The analyses indicated that early therapy initiation resulted in the lowest risk of AIDS and death, a finding later validated by a randomized trial of early versus deferred treatment initiation.4
This example illustrates the complementarity of randomized trials and observational analyses for causal inference: the effect estimates from observational data were used for provisional decision making until estimates from randomized trials became available, and randomized trial estimates were used as a benchmark for the observational analyses. After an emulation produces results close to the benchmark, there is greater confidence in expanded observational analyses that answer causal questions not considered by the randomized trial. In this case, the observational cohorts were also used to emulate target trials with outcomes (death, drug resistance) and in subgroups (people over 50) that could not be studied with precision in the randomized trial. This interplay between study types may fail in the absence of adequate target-trial emulation: observational analyses that did not specify a target trial led to implausibly high estimates of the benefit of early antiretroviral therapy initiation.5
Traditional analyses of observational data are often based on allocation of person-time to “exposed” and “unexposed” groups, rather than on explicit specification and emulation of a target trial. Resulting estimates may not correspond to a relevant causal contrast and therefore may not be easily mappable onto real-world interventions.5 This lack of actionable causal inference arises frequently in traditional analyses of both medical and nonmedical factors. An important reason to explicitly specify and emulate a target trial is to compare well-defined courses of action, which helps decision makers.
Another reason for emulating a target trial is to avert the selection and immortal time biases that arise from mishandling the start of follow-up (time zero) in analyses. As a rule, in causal analyses of both randomized trials and observational data, each participant’s time zero must be the time when they meet the eligibility criteria and are assigned to a treatment strategy. This rule is automatically enforced in randomized trials and in observational analyses emulating target trials. Observational analyses deviating from this rule led to conclusions, which were later disproved, that statins reduce cancer risk and that estrogen-plus-progestin therapy reduces the risk of coronary heart disease in postmenopausal women. Though sometimes appropriate, deviations from this rule must be justified on a case-by-case basis; for example, given the long period between exposure and outcome, the effect of cigarette smoking on lung cancer may be approximately quantified even when people are not followed from the time they begin smoking.
Causal effect estimates from observational analyses are often distrusted because of the lack of randomization, which may lead to confounded estimates due to noncomparable treatment groups. Confounding is a serious concern, but many high-profile observational failures have resulted instead from mishandling of time zero. In fact, reanalyses of observational data that explicitly emulated a target trial (and thus handled time zero correctly) yielded estimates compatible with those from randomized trials in the examples above. That is, the observational data were sufficient to approximately emulate randomization (i.e., to adjust for confounding); the failures were caused by selection and immortal time biases that can be avoided by explicitly emulating a target trial. Alternatively, these biases can be avoided by studious application of principles of causal inference and study design, but the target-trial approach helps in implementing these principles.
By itself, however, target-trial emulation cannot overcome confounding bias from noncomparable treatment groups. Despite correctly emulating all other components of a target trial, observational analyses may be invalidated if confounding cannot be adequately adjusted for. Sophisticated adjustment methods are sometimes necessary, but they work only when good data on confounders are available. Machine learning and artificial intelligence methods cannot compensate for missing data.
When confounder data are not available in an observational database, certain causal questions cannot feasibly be answered. For example, insurance claims databases may be inadequate for estimating effects of preventive interventions on all-cause mortality. It’s important to build safeguards (such as negative controls) into observational analyses to alert investigators when the danger of confounding is too high. Confounding adjustment is also infeasible for causal questions involving interventions (e.g., antihypertensive therapy) that are used almost exclusively by people with risk factors for the outcome (e.g., cardiovascular disease).
When data on confounders are insufficient, researchers can sometimes use methods such as instrumental variable estimation, which replace the need to adjust for confounders with other strong untestable conditions. For causal questions about the effects of an intervention (such as a policy change or new program) newly implemented in a population, the requirement for data on confounders for each person can, under certain conditions, be replaced by comparisons between preintervention and postintervention periods. For complicated causal questions involving interactions between persons in the population or systemwide effects, observational data sets cannot by themselves be used to emulate hypothetical target trials. For example, attempts to quantify individual and societal effects of interventions for controlling the U.S. opioid epidemic require simulation models integrating observational and experimental findings with assumptions about the structure of society and the health system.5
Explicit target-trial emulation increases the transparency and replicability of observational effect estimates. By including descriptions of target-trial protocols and their emulations in reports of observational analyses, investigators tell us precisely which causal effects they are estimating so that our replication attempts can be accurate. Also, explicit specification of the target trial imposes constraints on data analysis, reducing multiple comparisons and selective reporting of results. And it prevents data manipulations resulting in hard-to-interpret estimates that don’t correspond to any relevant intervention.
Determining the effectiveness and safety of many health interventions will continue to rely on observational data because randomized trials are not always feasible, ethical, or timely. Explicit emulation of a target trial using observational data helps eliminate unnecessary sources of bias so that concerns can focus on potential confounding bias due to nonrandomization.
残念ながら、私が聞きたかった番組の開始時刻までに目的の84.7 MHzはちゃんと読めなさそう。という事で、RADIKO で聞くことにしました。
次の図は「CONSORT声明」と呼ばれる、臨床試験について正確に報告するためのドキュメントの中にある、症例の組み入れを説明するための図です。このブログのタイトルでは取り合えず「症例組み入れ図」としています。
論文の中の図2にはこの症例組み入れ図のことを「フローチャート」と書かれています。原文では”flow diagram”になっています。その気になれば、power pointでもinkscapedでもexcelでも症例組み入れ図を書く事ができますが、これをRで書いてみようと思ったので、その忘備録として記載します。Rで書くのにGmiscというパッケージを使用しました。
今回とりあえず書いた症例組み入れ図は次のような図です。
Fundermentals of Clinical Trials 4th EditionのDefinition of Study Populationという項の図を参考にしています(数字は勝手に追加しました)
# install.packages('Gmisc', dependencies = TRUE) library(Gmisc) library(glue) library(htmlTable) library(grid) library(magrittr) org_cohort <- boxGrob(glue("Population at large", "n = {pop}", pop = txtInt(9999), .sep = "\n")) eligible <- boxGrob(glue("Population with Condition", "n = {pop}", pop = txtInt(999), .sep = "\n")) included0 <- boxGrob(glue("Study Population", "n = {incl}", incl = txtInt(900), .sep = "\n")) excluded0 <- boxGrob(glue("Population without Condition", "n = {exc0}", exc0 = txtInt(9000), .sep = "\n"), just = "left") excluded <- boxGrob(glue("With Condition but Ineligible", "n = {tot}", tot = txtInt(99), .sep = "\n"), just = "left") grid.newpage() vert <- spreadVertical(org_cohort = org_cohort, eligible = eligible, included0 = included0) excluded0 <- moveBox(excluded0, x = .8, y = coords(vert$eligible)$top + distance(vert$org_cohort, vert$eligible, half = TRUE, center = FALSE)) excluded <- moveBox(excluded, x = .8, y = coords(vert$included0)$top + distance(vert$eligible, vert$included0, half = TRUE, center = FALSE)) for (i in 1:(length(vert) - 1)) { connectGrob(vert[[i]], vert[[i + 1]], type = "vert") %>% print } connectGrob(vert$org_cohort, excluded0, type = "L") connectGrob(vert$eligible, excluded, type = "L") # Print boxes vert excluded excluded0 vert
こちらは、CRANのホームページで示されている例です。
library(Gmisc, quietly = TRUE) library(glue) library(htmlTable) library(grid) library(magrittr) org_cohort <- boxGrob(glue("Stockholm population", "n = {pop}", pop = txtInt(1632798), .sep = "\n")) eligible <- boxGrob(glue("Eligible", "n = {pop}", pop = txtInt(10032), .sep = "\n")) included <- boxGrob(glue("Randomized", "n = {incl}", incl = txtInt(122), .sep = "\n")) grp_a <- boxGrob(glue("Treatment A", "n = {recr}", recr = txtInt(43), .sep = "\n")) grp_b <- boxGrob(glue("Treatment B", "n = {recr}", recr = txtInt(122 - 43 - 30), .sep = "\n")) excluded <- boxGrob(glue("Excluded (n = {tot}):", " - not interested: {uninterested}", " - contra-indicated: {contra}", tot = 30, uninterested = 12, contra = 30 - 12, .sep = "\n"), just = "left") grid.newpage() vert <- spreadVertical(org_cohort, eligible = eligible, included = included, grps = grp_a) grps <- alignVertical(reference = vert$grps, grp_a, grp_b) %>% spreadHorizontal() vert$grps <- NULL excluded <- moveBox(excluded, x = .8, y = coords(vert$included)$top + distance(vert$eligible, vert$included, half = TRUE, center = FALSE)) for (i in 1:(length(vert) - 1)) { connectGrob(vert[[i]], vert[[i + 1]], type = "vert") %>% print } connectGrob(vert$included, grps[[1]], type = "N") connectGrob(vert$included, grps[[2]], type = "N") connectGrob(vert$eligible, excluded, type = "L") # Print boxes vert grps excluded
Gmiscの大体の使い方はわかったものの、しっかりと使い方を確認しようと思ってまずはググってみました。残念ながら日本語での詳しい解説文があまりありません。ここからしばらくはCRANの解説文の翻訳みたいなものです。
症例組み入れ図を生成するために使用される基本的なコンポーネントがあります。
ボックス: boxGrob関数とboxPropGrob関数で生成されます。
ボックス間の矢印は、connectGrob関数によって生成される。
これらは直接配置することもできるし、以下の原則に従って操作することもできる。
Spread – プロット全体を使用したいので、各要素を配置するか、または自動的に垂直または水平方向に広げるため、spreadHorizontal および spreadVertical 関数を使用します。
ボックスの整列 – 拡散の前または後に、ボックスを整列させたい場合があります: alignHorizontal および alignVertical 関数。
まずは1つのボックスを出力してみましょう。
grid.newpage() #描画する場所の初期化 txt <- "Just a plain box with some text - Note that newline is OK" boxGrob(txt) #txtに入っている文字列をそのままボックスの中に表示します。改行の情報もそのまま代入されています。\n でも良いようです。
このボックスに、任意の要素として配置やスタイルを設定できます。
grid.newpage() boxGrob("A large\noffset\nyellow\nbox", width = .8, height = .8, x = 0, y = 0, bjust = c("left", "bottom"), txt_gp = gpar(col = "darkblue", cex = 2), box_gp = gpar(fill = "lightyellow", col = "darkblue"))
boxPropGrobは、その名の通りプロポーションを表示するためのものです。
grid.newpage() boxPropGrob("A box with proportions", "Left side", "Right side", prop = .7)
ボックスには、ボックスとの間に簡単に線を引くことができる座標があります。座標は、coords 属性に格納されています。下の図は、2つのボックスの座標を示しています。
grid.newpage() smpl_bx <- boxGrob( label = "A simple box", x = .5, y = .9, just = "center") prop_bx <- boxPropGrob( label = "A split box", label_left = "Left side", label_right = "Right side", x = .5, y = .3, prop = .3, just = "center") plot(smpl_bx) plot(prop_bx) smpl_bx_coords <- coords(smpl_bx) grid.circle(y = smpl_bx_coords$y, x = smpl_bx_coords$x, r = unit(2, "mm"), gp = gpar(fill = "#FFFFFF99", col = "black")) grid.circle(y = smpl_bx_coords$bottom, x = smpl_bx_coords$right, r = unit(1, "mm"), gp = gpar(fill = "red")) grid.circle(y = smpl_bx_coords$top, x = smpl_bx_coords$right, r = unit(1, "mm"), gp = gpar(fill = "purple")) grid.circle(y = smpl_bx_coords$bottom, x = smpl_bx_coords$left, r = unit(1, "mm"), gp = gpar(fill = "blue")) grid.circle(y = smpl_bx_coords$top, x = smpl_bx_coords$left, r = unit(1, "mm"), gp = gpar(fill = "orange")) prop_bx_coords <- coords(prop_bx) grid.circle(y = prop_bx_coords$y, x = prop_bx_coords$x, r = unit(2, "mm"), gp = gpar(fill = "#FFFFFF99", col = "black")) grid.circle(y = prop_bx_coords$bottom, x = prop_bx_coords$right_x, r = unit(1, "mm"), gp = gpar(fill = "red")) grid.circle(y = prop_bx_coords$top, x = prop_bx_coords$right_x, r = unit(1, "mm"), gp = gpar(fill = "purple")) grid.circle(y = prop_bx_coords$bottom, x = prop_bx_coords$left_x, r = unit(1, "mm"), gp = gpar(fill = "blue")) grid.circle(y = prop_bx_coords$top, x = prop_bx_coords$left_x, r = unit(1, "mm"), gp = gpar(fill = "orange")) grid.circle(y = prop_bx_coords$bottom, x = prop_bx_coords$right, r = unit(2, "mm"), gp = gpar(fill = "red")) grid.circle(y = prop_bx_coords$top, x = prop_bx_coords$right, r = unit(2, "mm"), gp = gpar(fill = "purple")) grid.circle(y = prop_bx_coords$bottom, x = prop_bx_coords$left, r = unit(2, "mm"), gp = gpar(fill = "blue")) grid.circle(y = prop_bx_coords$top, x = prop_bx_coords$left, r = unit(2, "mm"), gp = gpar(fill = "orange"))
矢印でボックスをつなぐために、connectGrob関数があります。ここでは、一連のボックスを接続するためにどのように使用するかの例を示します。
grid.newpage() # Initiate the boxes that we want to connect side <- boxPropGrob("Side", "Left", "Right", prop = .3, x = 0, y = .9, bjust = c(0,1)) start <- boxGrob("Top", x = .6, y = coords(side)$y, box_gp = gpar(fill = "yellow")) bottom <- boxGrob("Bottom", x = .6, y = 0, bjust = "bottom") sub_side_left <- boxGrob("Left", x = coords(side)$left_x, y = 0, bjust = "bottom") sub_side_right <- boxGrob("Right", x = coords(side)$right_x, y = 0, bjust = "bottom") odd <- boxGrob("Odd\nbox", x = coords(side)$right, y = .5) odd2 <- boxGrob("Also odd", x = coords(odd)$right + distance(bottom, odd, type = "h", half = TRUE) - unit(2, "mm"), y = 0, bjust = c(1,0)) exclude <- boxGrob("Exclude:\n - Too sick\n - Prev. surgery", x = 1, y = coords(bottom)$top + distance(start, bottom, type = "v", half = TRUE), just = "left", bjust = "right") # Connect the boxes and print/plot them connectGrob(start, bottom, "vertical") connectGrob(start, side, "horizontal") connectGrob(bottom, odd, "Z", "l") connectGrob(odd, odd2, "N", "l") connectGrob(side, sub_side_left, "v", "l") connectGrob(side, sub_side_right, "v", "r") connectGrob(start, exclude, "-", lty_gp = gpar(lwd = 2, col = "darkred", fill = "darkred")) # Print the grobs start bottom side exclude sub_side_left sub_side_right odd odd2
ボックスを水平または垂直に整列させたいことがよくあります。そのために、alignHorizontal()とalignVertical()という2つの関数が用意されています。
align_1 <- boxGrob("Align 1", y = .9, x = 0, bjust = c(0), box_gp = gpar(fill = "#E6E8EF")) align_2 <- boxPropGrob("Align 2", "Placebo", "Treatment", prop = .7, y = .8, x = .5) align_3 <- boxGrob("Align 3\nvertical\ntext", y = 1, x = 1, bjust = c(1, 1), box_gp = gpar(fill = "#E6E8EF")) b1 <- boxGrob("B1", y = .3, x = .1, bjust = c(0)) b2 <- boxGrob("B2 with long\ndescription", y = .6, x = .5) b3 <- boxGrob("B3", y = .2, x = .8, bjust = c(0, 1)) grid.newpage() align_1 alignHorizontal(reference = align_1, b1, b2, b3, .position = "left") align_2 alignHorizontal(reference = align_2, b1, b2, b3, .position = "center", .sub_position = "left") alignHorizontal(reference = align_2, b1, b2, b3, .position = "left", .sub_position = "right") align_3 alignHorizontal(reference = align_3, b1, b2, b3, .position = "right")
バーティカルアライメントの類似例を紹介します
align_1 <- boxGrob("Align 1\nvertical\ntext", y = 1, x = 1, bjust = c(1, 1), box_gp = gpar(fill = "#E6E8EF")) align_2 <- boxPropGrob("Align 2", "Placebo", "Treatment", prop = .7, y = .5, x = .6) align_3 <- boxGrob("Align 3", y = 0, x = 0, bjust = c(0, 0), box_gp = gpar(fill = "#E6E8EF")) b1 <- boxGrob("B1", y = .3, x = 0.1, bjust = c(0, 0)) b2 <- boxGrob("B2 with long\ndescription", y = .6, x = .3) b3 <- boxGrob("B3", y = .2, x = .85, bjust = c(0, 1)) grid.newpage() align_1 alignVertical(reference = align_1, b1, b2, b3, .position = "top") align_2 alignVertical(reference = align_2, b1, b2, b3, .position = "center") align_3 alignVertical(reference = align_3, b1, b2, b3, .position = "bottom")
整列と同様に、viewport内の利用可能なスペースをすべて使用するために、スペース内でボックスを広げたいことがよくあります。これは、spreadHorizontal()とspreadVertical()で行うことができます。SpreadHorizontal()とspreadVertical()は、スパン全体に広げることも、.toと.from引数で定義されたサブスパンの間に広げることもできます。
b1 <- boxGrob("B1", y = .85, x = 0.1, bjust = c(0, 0)) b2 <- boxGrob("B2", y = .65, x = .6) b3 <- boxGrob("B3", y = .45, x = .6) b4 <- boxGrob("B4 with long\ndescription", y = .7, x = .8) from <- boxGrob("from", y = .25, x = .05, box_gp = gpar(fill = "darkgreen"), txt_gp = gpar(col = "white")) to <- boxGrob("to this wide box", y = coords(from)$y, x = .95, bjust = "right", box_gp = gpar(fill = "darkred"), txt_gp = gpar(col = "white")) txtOut <- function(txt, refBx) { grid.text(txt, x = unit(2, "mm"), y = coords(refBx)$top + unit(2, "mm"), just = c("left", "bottom")) grid.lines(y = coords(refBx)$top + unit(1, "mm"), gp = gpar(col = "grey")) } grid.newpage() txtOut("Basic", b1) alignVertical(reference = b1, b1, b2, b3, b4, .position = "top") %>% spreadHorizontal() txtOut("From-to", b2) alignVertical(reference = b2, b1, b2, b3, b4, .position = "top") %>% spreadHorizontal(.from = .2, .to = .7) txtOut("From-to with center and reverse the box order", b3) alignVertical(reference = b3, b1, b2, b3, b4, .position = "top") %>% spreadHorizontal(.from = .7, .to = .2, .type = "center") txtOut("Between boxes", from) from to alignVertical(reference = from, b1, b2, b3, b4, .position = "top") %>% spreadHorizontal(.from = from, .to = to) # Now we switch the order and set the type to center the distance between the boxes bottom_from <- moveBox(from, x = coords(to)$right, y = 0, just = c(1, 0)) bottom_to <- moveBox(to, x = coords(from)$left, y = 0, just = c(0, 0)) bottom_from bottom_to alignVertical(reference = bottom_from, b1, b2, b3, b4, .position = "bottom") %>% spreadHorizontal(.from = bottom_from, .to = bottom_to, .type = "center")
垂直方向への広がりも同じパターンです
b1 <- boxGrob("B1", y = .8, x = 0.1, bjust = c(0, 0)) b2 <- boxGrob("B2 with long\ndescription", y = .5, x = .5) b3 <- boxGrob("B3", y = .2, x = .8) b4 <- boxGrob("B4", y = .7, x = .8) txtOut <- function(txt, refBx) { grid.text(txt, x = coords(refBx)$left - unit(2, "mm"), y = .5, just = c("center", "bottom"), rot = 90) grid.lines(x = coords(refBx)$left - unit(1, "mm"), gp = gpar(col = "grey")) } grid.newpage() txtOut("Basic", b1) alignHorizontal(reference = b1, b1, b2, b3, b4, .position = "left") %>% spreadVertical() txtOut("From-to", b2) alignHorizontal(reference = b2, b1, b2, b3, b4, .position = "left") %>% spreadVertical(.from = .2, .to = .7) txtOut("From-to with center and reverse the box order", b3) alignHorizontal(reference = b3, b1, b2, b3, b4, .position = "left") %>% spreadVertical(.from = .7, .to = .2, .type = "center")
R式やbquote関数を使って、太字や斜体のテキスト、あるいは数式を表示することができます。
式に関するいくつかの注意点
複数の要素を持つ式は、ペーストを使って結合する必要があります。
例:expression(paste(beta, “1”))はβ1を生成します。
expressionの中でpasteを使用した場合の動作は、通常のpaste0の動作に似ています(例:セパレートスペースなし)。
ギリシャ文字は引用符の外に名前を入力することができます。
例:expression(beta)はβに、expression(Gamma)はΓになります(大文字に注意してください)。
上付き文字はexpression(x^2)、下付き文字はexpression(x[2])となります。
grid.newpage() ############### # Expressions # ############### # Font style alignVertical( reference = 1, .position = "top", boxGrob(expression(bold("Bold text"))), boxGrob(expression(italic("Italics text"))), boxGrob(expression(paste("Mixed: ", italic("Italics"), " and ", bold("bold"))))) %>% spreadHorizontal # Math alignVertical( reference = .5, boxGrob(expression(paste("y = ", beta[0], " + ", beta[1], X[1], " + ", beta[2], X[2]^2))), boxGrob(expression(sum(n, i == 1, x) %subset% " \u211D")), boxGrob(expression(beta ~~ gamma ~~ Gamma))) %>% spreadHorizontal ########## # Quotes # ########## a = 5 alignVertical( reference = 0, .position = "bottom", bquote(alpha == theta[1] * .(a) + ldots) %>% boxGrob, paste("argument", sQuote("x"), "\nmust be non-zero") %>% boxGrob) %>% spreadHorizontal(.from = .2, .to = .8)
See the plotmath
help file for more details.
その昔楽天KOBOを購入しました。軽量ポケットサイズでバッテリーも長持ちで、目に優しい電子ペーパーのディスプレイと言う、ポケットに掘り込んでおいて時間つぶしになにか読むには当時としてはいい買い物だったのですが、加齢とともに小さな活字では読みにくくなってきて、より解像度の良い端末も出てきたことから、KOBOを使うことがなくなりました。
それでも、最近入手した書籍を、この端末で持ち歩いて読んでみようという気になりました。ところが入手した書籍がepub形式で、そのままではKOBOでは読めません。ネットで調べても無料で変換できるようなサイトやアプリもないようです。単純にこの方法をわざわざ記事にしているサイトがないだけで、よく見ると書いてあるサイトも有りました。Macがあればかんたんに変換できることが解りました。物忘れの良い自分用の忘備録として残します。
拡張子が .epub だったので、これを .kepub.epub にします