症例組み入れ図をRで書いてみました
次の図は「CONSORT声明」と呼ばれる、臨床試験について正確に報告するためのドキュメントの中にある、症例の組み入れを説明するための図です。このブログのタイトルでは取り合えず「症例組み入れ図」としています。
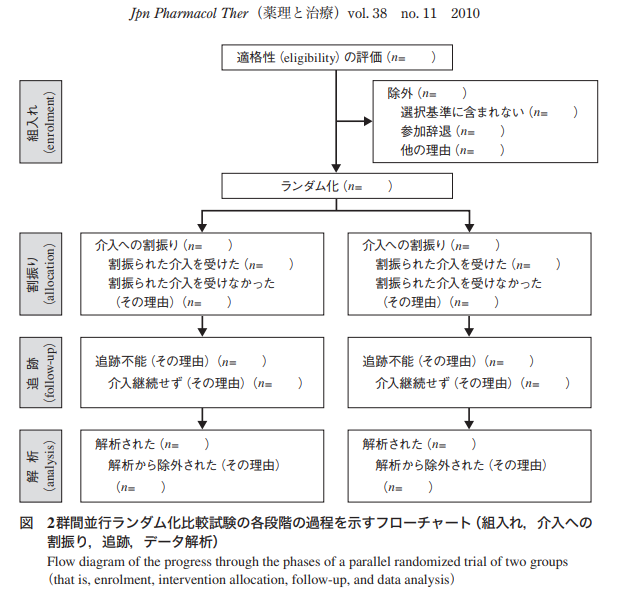
論文の中の図2にはこの症例組み入れ図のことを「フローチャート」と書かれています。原文では”flow diagram”になっています。その気になれば、power pointでもinkscapedでもexcelでも症例組み入れ図を書く事ができますが、これをRで書いてみようと思ったので、その忘備録として記載します。Rで書くのにGmiscというパッケージを使用しました。
まずは完成した症例組み入れ図
今回とりあえず書いた症例組み入れ図は次のような図です。
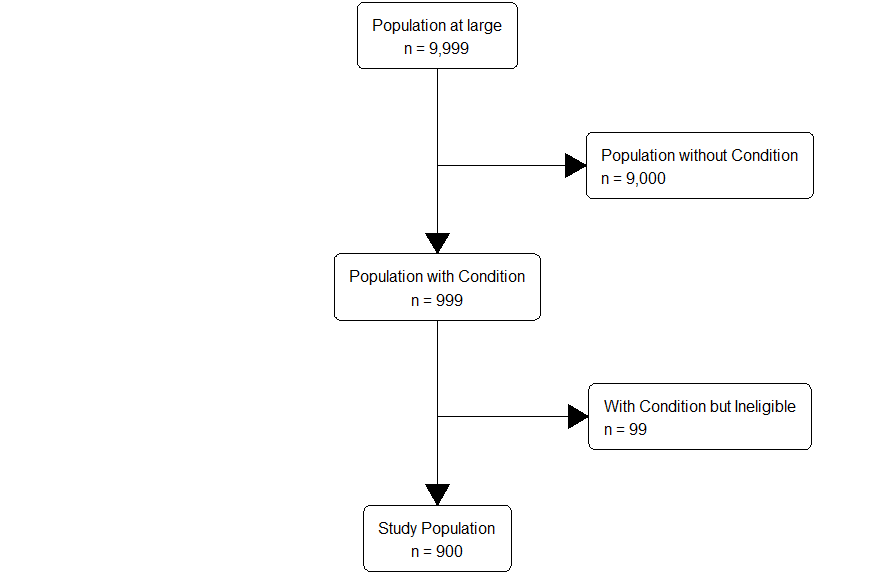
Fundermentals of Clinical Trials 4th EditionのDefinition of Study Populationという項の図を参考にしています(数字は勝手に追加しました)
上の症例組み入れ図のRのコードです
# install.packages('Gmisc', dependencies = TRUE)

library(Gmisc)
library(glue)
library(htmlTable)
library(grid)
library(magrittr)

org_cohort <- boxGrob(glue("Population at large",
                           "n = {pop}", pop = txtInt(9999), .sep = "\n"))
eligible <- boxGrob(glue("Population with Condition",
                         "n = {pop}", pop = txtInt(999), .sep = "\n"))
included0 <- boxGrob(glue("Study Population",
                          "n = {incl}", incl = txtInt(900), .sep = "\n"))
excluded0 <- boxGrob(glue("Population without Condition",
                          "n = {exc0}", exc0 = txtInt(9000), .sep = "\n"), just = "left")
excluded <- boxGrob(glue("With Condition but Ineligible",
                         "n = {tot}", tot = txtInt(99), .sep = "\n"), just = "left")

grid.newpage()

vert <- spreadVertical(org_cohort = org_cohort, eligible = eligible, included0 = included0)


excluded0 <- moveBox(excluded0, x = .8, y = coords(vert$eligible)$top
                     + distance(vert$org_cohort, vert$eligible, half = TRUE, center = FALSE))
excluded <- moveBox(excluded, x = .8, y = coords(vert$included0)$top
                    + distance(vert$eligible, vert$included0, half = TRUE, center = FALSE))

for (i in 1:(length(vert) - 1))
{ connectGrob(vert[[i]], vert[[i + 1]], type = "vert") %>% print }

connectGrob(vert$org_cohort, excluded0, type = "L")
connectGrob(vert$eligible, excluded, type = "L")

# Print boxes vert
excluded
excluded0
vert
もう一例別の症例組み入れ図です
こちらは、CRANのホームページで示されている例です。
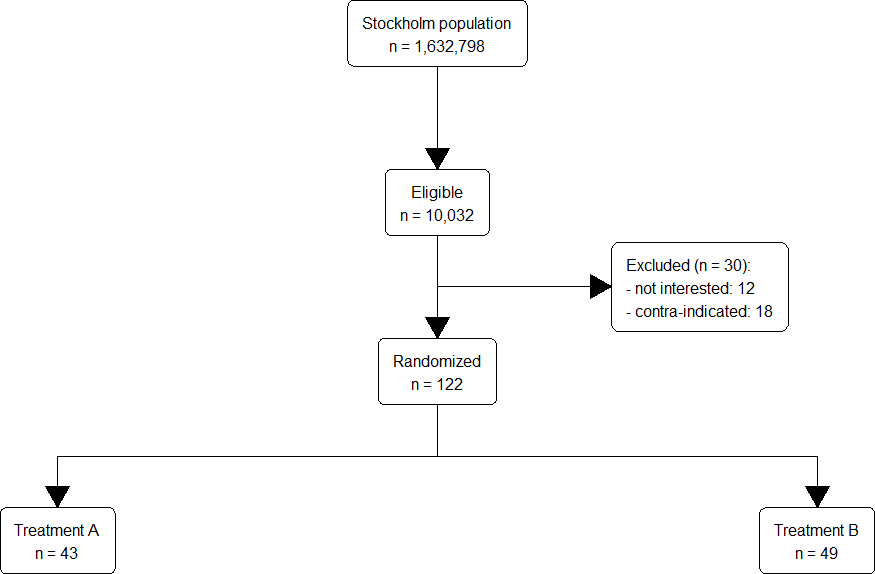
こちらの症例組み入れ図のRのコードです
library(Gmisc, quietly = TRUE)
library(glue)
library(htmlTable)
library(grid)
library(magrittr)

org_cohort <- boxGrob(glue("Stockholm population",
                           "n = {pop}",
                           pop = txtInt(1632798),
                           .sep = "\n"))
eligible <- boxGrob(glue("Eligible",
                          "n = {pop}",
                           pop = txtInt(10032),
                           .sep = "\n"))
included <- boxGrob(glue("Randomized",
                         "n = {incl}",
                         incl = txtInt(122),
                         .sep = "\n"))
grp_a <- boxGrob(glue("Treatment A",
                      "n = {recr}",
                      recr = txtInt(43),
                      .sep = "\n"))

grp_b <- boxGrob(glue("Treatment B",
                      "n = {recr}",
                      recr = txtInt(122 - 43 - 30),
                      .sep = "\n"))

excluded <- boxGrob(glue("Excluded (n = {tot}):",
                         " - not interested: {uninterested}",
                         " - contra-indicated: {contra}",
                         tot = 30,
                         uninterested = 12,
                         contra = 30 - 12,
                         .sep = "\n"),
                    just = "left")

grid.newpage()
vert <- spreadVertical(org_cohort,
                       eligible = eligible,
                       included = included,
                       grps = grp_a)
grps <- alignVertical(reference = vert$grps,
                      grp_a, grp_b) %>%
  spreadHorizontal()
vert$grps <- NULL

excluded <- moveBox(excluded,
                    x = .8,
                    y = coords(vert$included)$top + distance(vert$eligible, vert$included, half = TRUE, center = FALSE))

for (i in 1:(length(vert) - 1)) {
  connectGrob(vert[[i]], vert[[i + 1]], type = "vert") %>%
    print
}
connectGrob(vert$included, grps[[1]], type = "N")
connectGrob(vert$included, grps[[2]], type = "N")

connectGrob(vert$eligible, excluded, type = "L")

# Print boxes
vert
grps
excluded
Gmiscの使い方
Gmiscの大体の使い方はわかったものの、しっかりと使い方を確認しようと思ってまずはググってみました。残念ながら日本語での詳しい解説文があまりありません。ここからしばらくはCRANの解説文の翻訳みたいなものです。
Gmiscの基本コンポーネントの説明
症例組み入れ図を生成するために使用される基本的なコンポーネントがあります。
ボックス: boxGrob関数とboxPropGrob関数で生成されます。
ボックス間の矢印は、connectGrob関数によって生成される。
これらは直接配置することもできるし、以下の原則に従って操作することもできる。
Spread – プロット全体を使用したいので、各要素を配置するか、または自動的に垂直または水平方向に広げるため、spreadHorizontal および spreadVertical 関数を使用します。
ボックスの整列 – 拡散の前または後に、ボックスを整列させたい場合があります: alignHorizontal および alignVertical 関数。
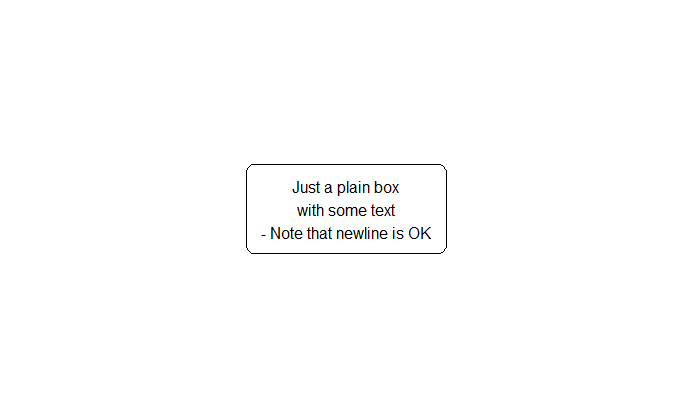
基本的なボックス
まずは1つのボックスを出力してみましょう。
grid.newpage() #描画する場所の初期化
txt <-
"Just a plain box
with some text
- Note that newline is OK"
boxGrob(txt) #txtに入っている文字列をそのままボックスの中に表示します。改行の情報もそのまま代入されています。\n でも良いようです。
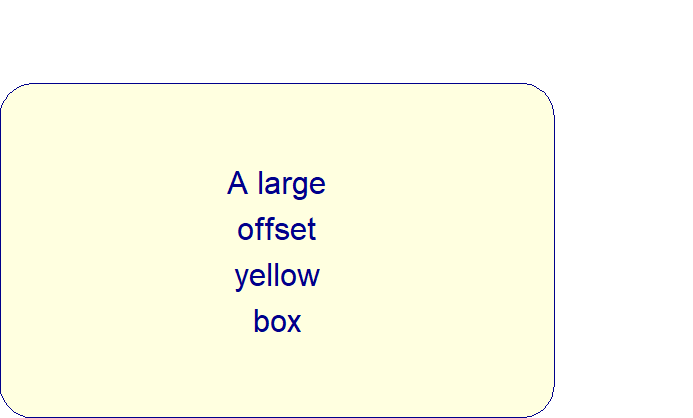
このボックスに、任意の要素として配置やスタイルを設定できます。
grid.newpage()
boxGrob("A large\noffset\nyellow\nbox",
        width = .8, height = .8,
        x = 0, y = 0,
        bjust = c("left", "bottom"),
        txt_gp = gpar(col = "darkblue", cex = 2),
        box_gp = gpar(fill = "lightyellow", col = "darkblue"))
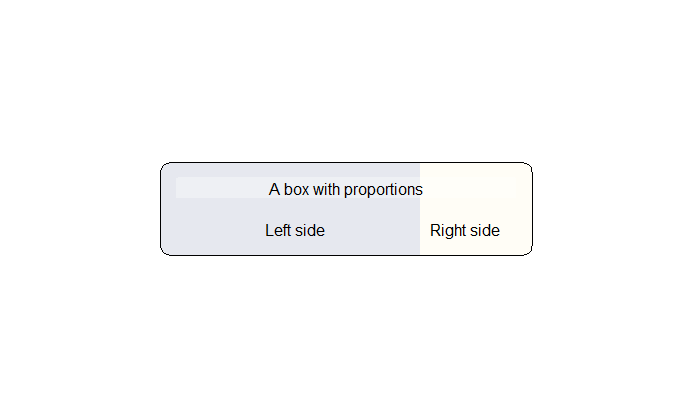
プロポーションを表示するボックス
boxPropGrobは、その名の通りプロポーションを表示するためのものです。
grid.newpage()
boxPropGrob("A box with proportions",
            "Left side", "Right side",
            prop = .7)
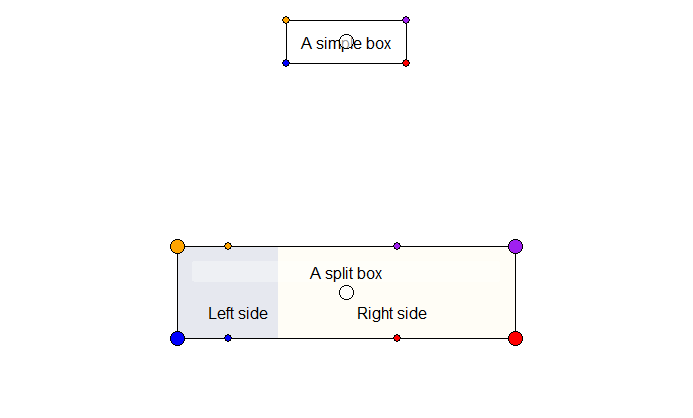
ボックスの座標
ボックスには、ボックスとの間に簡単に線を引くことができる座標があります。座標は、coords 属性に格納されています。下の図は、2つのボックスの座標を示しています。
grid.newpage()
smpl_bx <- boxGrob(
  label = "A simple box",
  x = .5,
  y = .9,
  just = "center")

prop_bx <- boxPropGrob(
  label = "A split box",
  label_left = "Left side",
  label_right = "Right side",
  x = .5,
  y = .3,
  prop = .3,
  just = "center")

plot(smpl_bx)
plot(prop_bx)

smpl_bx_coords <- coords(smpl_bx)
grid.circle(y = smpl_bx_coords$y,
            x = smpl_bx_coords$x,
            r = unit(2, "mm"),
            gp = gpar(fill = "#FFFFFF99", col = "black"))
grid.circle(y = smpl_bx_coords$bottom,
            x = smpl_bx_coords$right,
            r = unit(1, "mm"),
            gp = gpar(fill = "red"))
grid.circle(y = smpl_bx_coords$top,
            x = smpl_bx_coords$right,
            r = unit(1, "mm"),
            gp = gpar(fill = "purple"))
grid.circle(y = smpl_bx_coords$bottom,
            x = smpl_bx_coords$left,
            r = unit(1, "mm"),
            gp = gpar(fill = "blue"))
grid.circle(y = smpl_bx_coords$top,
            x = smpl_bx_coords$left,
            r = unit(1, "mm"),
            gp = gpar(fill = "orange"))

prop_bx_coords <- coords(prop_bx)
grid.circle(y = prop_bx_coords$y,
            x = prop_bx_coords$x,
            r = unit(2, "mm"),
            gp = gpar(fill = "#FFFFFF99", col = "black"))
grid.circle(y = prop_bx_coords$bottom,
            x = prop_bx_coords$right_x,
            r = unit(1, "mm"),
            gp = gpar(fill = "red"))
grid.circle(y = prop_bx_coords$top,
            x = prop_bx_coords$right_x,
            r = unit(1, "mm"),
            gp = gpar(fill = "purple"))
grid.circle(y = prop_bx_coords$bottom,
            x = prop_bx_coords$left_x,
            r = unit(1, "mm"),
            gp = gpar(fill = "blue"))
grid.circle(y = prop_bx_coords$top,
            x = prop_bx_coords$left_x,
            r = unit(1, "mm"),
            gp = gpar(fill = "orange"))

grid.circle(y = prop_bx_coords$bottom,
            x = prop_bx_coords$right,
            r = unit(2, "mm"),
            gp = gpar(fill = "red"))
grid.circle(y = prop_bx_coords$top,
            x = prop_bx_coords$right,
            r = unit(2, "mm"),
            gp = gpar(fill = "purple"))
grid.circle(y = prop_bx_coords$bottom,
            x = prop_bx_coords$left,
            r = unit(2, "mm"),
            gp = gpar(fill = "blue"))
grid.circle(y = prop_bx_coords$top,
            x = prop_bx_coords$left,
            r = unit(2, "mm"),
            gp = gpar(fill = "orange"))
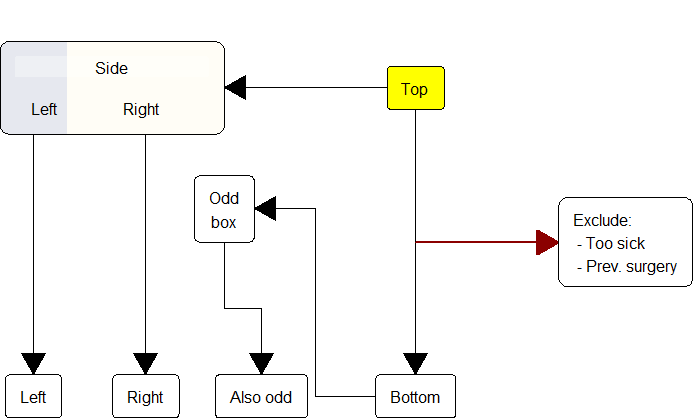
ボックスの連結
矢印でボックスをつなぐために、connectGrob関数があります。ここでは、一連のボックスを接続するためにどのように使用するかの例を示します。
grid.newpage()
# Initiate the boxes that we want to connect
side <- boxPropGrob("Side", "Left", "Right",
                    prop = .3,
                    x = 0, y = .9,
                    bjust = c(0,1))
start <- boxGrob("Top",
                 x = .6, y = coords(side)$y,
                 box_gp = gpar(fill = "yellow"))
bottom <- boxGrob("Bottom",
                  x = .6, y = 0,
                  bjust = "bottom")


sub_side_left <- boxGrob("Left",
                         x = coords(side)$left_x,
                         y = 0,
                         bjust = "bottom")
sub_side_right <- boxGrob("Right",
                          x = coords(side)$right_x,
                          y = 0,
                          bjust = "bottom")

odd <- boxGrob("Odd\nbox",
               x = coords(side)$right,
               y = .5)

odd2 <- boxGrob("Also odd",
               x = coords(odd)$right +
                 distance(bottom, odd, type = "h", half = TRUE) -
                 unit(2, "mm"),
               y = 0,
               bjust = c(1,0))

exclude <- boxGrob("Exclude:\n - Too sick\n - Prev. surgery",
                   x = 1,
                   y = coords(bottom)$top +
                     distance(start, bottom, type = "v", half = TRUE),
                   just = "left", bjust = "right")

# Connect the boxes and print/plot them
connectGrob(start, bottom, "vertical")
connectGrob(start, side, "horizontal")
connectGrob(bottom, odd, "Z", "l")
connectGrob(odd, odd2, "N", "l")
connectGrob(side, sub_side_left, "v", "l")
connectGrob(side, sub_side_right, "v", "r")
connectGrob(start, exclude, "-",
            lty_gp = gpar(lwd = 2, col = "darkred", fill = "darkred"))

# Print the grobs
start
bottom
side
exclude
sub_side_left
sub_side_right
odd
odd2
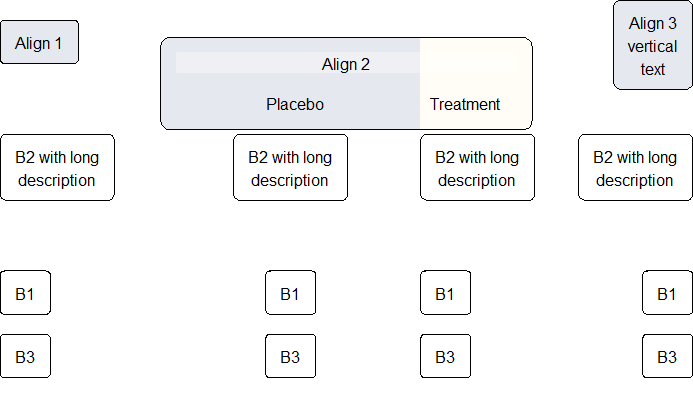
整列
ボックスを水平または垂直に整列させたいことがよくあります。そのために、alignHorizontal()とalignVertical()という2つの関数が用意されています。
align_1 <- boxGrob("Align 1",
                   y = .9,
                   x = 0,
                   bjust = c(0),
                   box_gp = gpar(fill = "#E6E8EF"))

align_2 <- boxPropGrob("Align 2",
                       "Placebo",
                       "Treatment",
                       prop = .7,
                       y = .8,
                       x = .5)

align_3 <- boxGrob("Align 3\nvertical\ntext",
                   y = 1,
                   x = 1,
                   bjust = c(1, 1),
                   box_gp = gpar(fill = "#E6E8EF"))

b1 <- boxGrob("B1",
              y = .3,
              x = .1,
              bjust = c(0))
b2 <- boxGrob("B2 with long\ndescription",
              y = .6,
              x = .5)
b3 <- boxGrob("B3",
              y = .2,
              x = .8,
              bjust = c(0, 1))

grid.newpage()
align_1
alignHorizontal(reference = align_1,
                b1, b2, b3,
                .position = "left")

align_2
alignHorizontal(reference = align_2,
                b1, b2, b3,
                .position = "center",
                .sub_position = "left")
alignHorizontal(reference = align_2,
                b1, b2, b3,
                .position = "left",
                .sub_position = "right")

align_3
alignHorizontal(reference = align_3,
                b1, b2, b3,
                .position = "right")
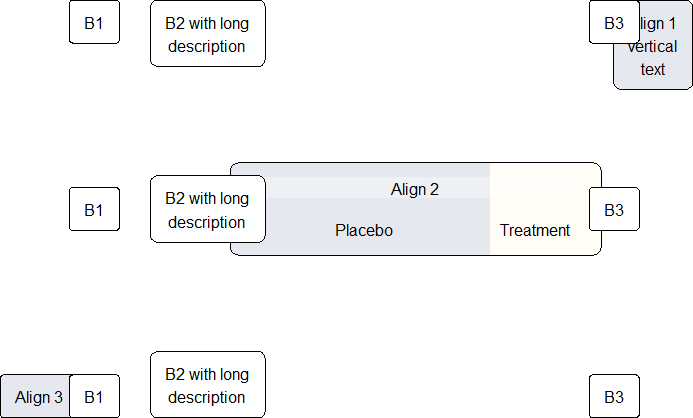
バーティカルアライメントの類似例を紹介します
align_1 <- boxGrob("Align 1\nvertical\ntext",
                   y = 1,
                   x = 1,
                   bjust = c(1, 1),
                   box_gp = gpar(fill = "#E6E8EF"))

align_2 <- boxPropGrob("Align 2",
                       "Placebo",
                       "Treatment",
                       prop = .7,
                       y = .5,
                       x = .6)

align_3 <- boxGrob("Align 3",
                   y = 0,
                   x = 0,
                   bjust = c(0, 0),
                   box_gp = gpar(fill = "#E6E8EF"))


b1 <- boxGrob("B1",
              y = .3,
              x = 0.1,
              bjust = c(0, 0))
b2 <- boxGrob("B2 with long\ndescription",
              y = .6,
              x = .3)
b3 <- boxGrob("B3",
              y = .2,
              x = .85,
              bjust = c(0, 1))

grid.newpage()
align_1
alignVertical(reference = align_1,
              b1, b2, b3,
              .position = "top")

align_2
alignVertical(reference = align_2,
              b1, b2, b3,
              .position = "center")

align_3
alignVertical(reference = align_3,
              b1, b2, b3,
              .position = "bottom")
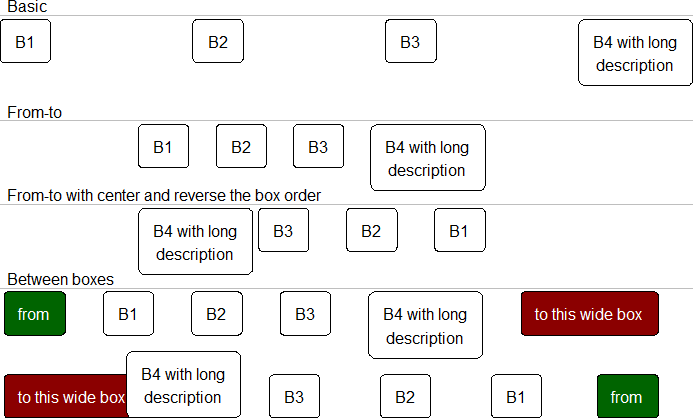
Spreading
整列と同様に、viewport内の利用可能なスペースをすべて使用するために、スペース内でボックスを広げたいことがよくあります。これは、spreadHorizontal()とspreadVertical()で行うことができます。SpreadHorizontal()とspreadVertical()は、スパン全体に広げることも、.toと.from引数で定義されたサブスパンの間に広げることもできます。
b1 <- boxGrob("B1",
              y = .85,
              x = 0.1,
              bjust = c(0, 0))
b2 <- boxGrob("B2",
              y = .65,
              x = .6)
b3 <- boxGrob("B3",
              y = .45,
              x = .6)
b4 <- boxGrob("B4 with long\ndescription",
              y = .7,
              x = .8)

from <- boxGrob("from",
                y = .25,
                x = .05,
                box_gp = gpar(fill = "darkgreen"),
                txt_gp = gpar(col = "white"))
to <- boxGrob("to this wide box",
              y = coords(from)$y,
              x = .95,
              bjust = "right",
              box_gp = gpar(fill = "darkred"),
              txt_gp = gpar(col = "white"))


txtOut <- function(txt, refBx) {
  grid.text(txt,
            x = unit(2, "mm"),
            y = coords(refBx)$top + unit(2, "mm"),
            just = c("left", "bottom"))
  grid.lines(y = coords(refBx)$top + unit(1, "mm"),
             gp = gpar(col = "grey"))
}
grid.newpage()
txtOut("Basic", b1)
alignVertical(reference = b1,
              b1, b2, b3, b4,
              .position = "top") %>%
  spreadHorizontal()

txtOut("From-to", b2)
alignVertical(reference = b2,
              b1, b2, b3, b4,
              .position = "top") %>%
  spreadHorizontal(.from = .2,
                   .to = .7)

txtOut("From-to with center and reverse the box order", b3)
alignVertical(reference = b3,
              b1, b2, b3, b4,
              .position = "top") %>%
  spreadHorizontal(.from = .7,
                   .to = .2,
                   .type = "center")

txtOut("Between boxes", from)
from
to
alignVertical(reference = from,
              b1, b2, b3, b4,
              .position = "top") %>%
  spreadHorizontal(.from = from,
                   .to = to)

# Now we switch the order and set the type to center the distance between the boxes
bottom_from <- moveBox(from, x = coords(to)$right, y = 0, just = c(1, 0))
bottom_to <- moveBox(to, x = coords(from)$left, y = 0, just = c(0, 0))
bottom_from
bottom_to
alignVertical(reference = bottom_from,
              b1, b2, b3, b4,
              .position = "bottom") %>%
  spreadHorizontal(.from = bottom_from,
                   .to = bottom_to,
                   .type = "center")
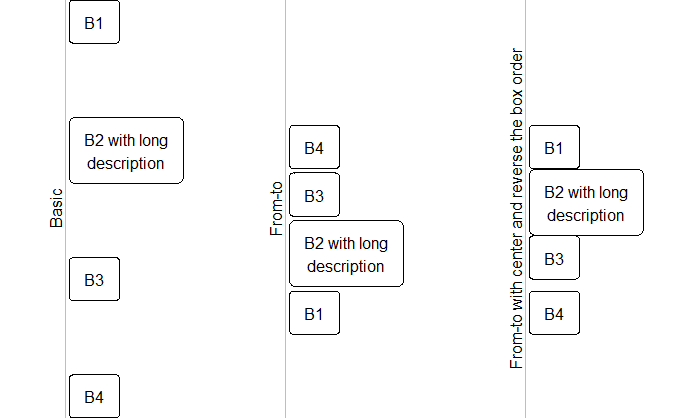
垂直方向への広がりも同じパターンです
b1 <- boxGrob("B1",
              y = .8,
              x = 0.1,
              bjust = c(0, 0))
b2 <- boxGrob("B2 with long\ndescription",
              y = .5,
              x = .5)
b3 <- boxGrob("B3",
              y = .2,
              x = .8)
b4 <- boxGrob("B4",
              y = .7,
              x = .8)


txtOut <- function(txt, refBx) {
  grid.text(txt,
            x = coords(refBx)$left - unit(2, "mm"),
            y = .5,
            just = c("center", "bottom"),
            rot = 90)
  grid.lines(x = coords(refBx)$left - unit(1, "mm"),
             gp = gpar(col = "grey"))
}

grid.newpage()
txtOut("Basic", b1)
alignHorizontal(reference = b1,
                b1, b2, b3, b4,
                .position = "left") %>%
  spreadVertical()

txtOut("From-to", b2)
alignHorizontal(reference = b2,
                b1, b2, b3, b4,
                .position = "left") %>%
  spreadVertical(.from = .2,
                 .to = .7)

txtOut("From-to with center and reverse the box order", b3)
alignHorizontal(reference = b3,
                b1, b2, b3, b4,
                .position = "left") %>%
  spreadVertical(.from = .7,
                 .to = .2,
                 .type = "center")
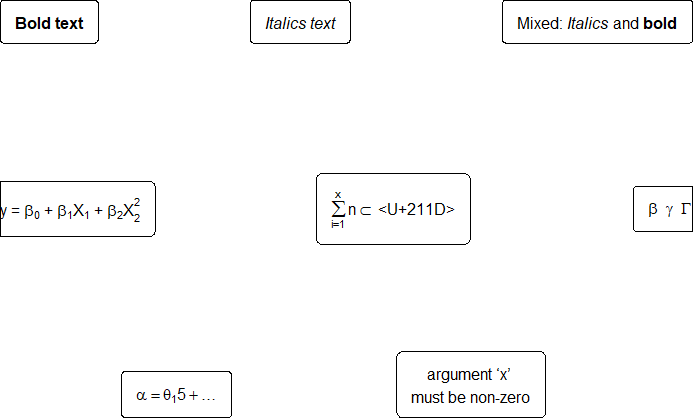
ボックス内の数学式
R式やbquote関数を使って、太字や斜体のテキスト、あるいは数式を表示することができます。
式に関するいくつかの注意点
複数の要素を持つ式は、ペーストを使って結合する必要があります。
例:expression(paste(beta, “1”))はβ1を生成します。
expressionの中でpasteを使用した場合の動作は、通常のpaste0の動作に似ています(例:セパレートスペースなし)。
ギリシャ文字は引用符の外に名前を入力することができます。
例:expression(beta)はβに、expression(Gamma)はΓになります(大文字に注意してください)。
上付き文字はexpression(x^2)、下付き文字はexpression(x[2])となります。
grid.newpage()
###############
# Expressions #
###############
# Font style
alignVertical(
  reference = 1,
  .position = "top",
  boxGrob(expression(bold("Bold text"))),
  boxGrob(expression(italic("Italics text"))),
  boxGrob(expression(paste("Mixed: ", italic("Italics"), " and ", bold("bold"))))) %>%
  spreadHorizontal

# Math
alignVertical(
  reference = .5,
  boxGrob(expression(paste("y = ", beta[0], " + ", beta[1], X[1], " + ", beta[2], X[2]^2))),
  boxGrob(expression(sum(n, i == 1, x) %subset% " \u211D")),
  boxGrob(expression(beta ~~ gamma ~~ Gamma))) %>%
  spreadHorizontal

##########
# Quotes #
##########
a = 5
alignVertical(
  reference = 0,
  .position = "bottom",
  bquote(alpha == theta[1] * .(a) + ldots) %>% boxGrob,
  paste("argument", sQuote("x"), "\nmust be non-zero") %>% boxGrob) %>%
  spreadHorizontal(.from = .2, .to = .8)
See the plotmath help file for more details.
いつも勉強させていただいております。
質問です。
この関数を使う際、boxの中の言葉を日本語表示はできないでしょうか?
ご存知でしたら、ご教授頂けますと幸いです。
コメントありがとうございます。
私の環境では、他のパッケージでもRで日本語を表示させることが難しいようです。
Oshima様
ご返信誠に有難うございます。
参考になりました。